When execution of a Crop Plans worksheet terminates successfully you can check the contents of the Record worksheet to verify that there were no errors during the simulation and to see the sequence of events and any intermediate results that were requested (e.g. Record Stand events). The View Record ( ) button provides tools to facilitate comparing results of growth simulations.
If all seems to be in order, you may view the results in several locations with or without some tools.
You can examine the Record and other worksheets directly to see the results.
- The Record worksheet includes any error messages as well as the Yields for each crop plan.
- Immediately after completion of the simulation the Yields, Stand, Charts, MyCharts and Graphs worksheets portray results of the last Crop Plan executed.
- You can save the Record worksheet into the MGM Records workbook from which it may be retrieved for later viewing using the View Record button.
- The contents of the Record worksheet may be copied (but not the entire worksheet) and pasted into other workbooks or locations for other analysis or summary. The entire Record worksheet may not be copied from the MGM workbook, but it may be saved into the MGM Records workbook which may be opened independently. Worksheets in the MGM Records workbook may be copied or moved as desired.
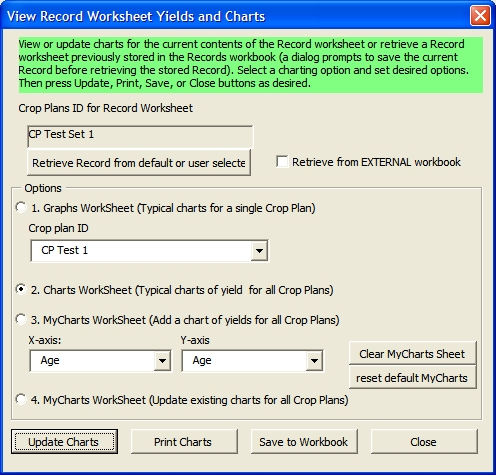
You can use the View Record button () to:
- View the contents of the MGM workbook Record worksheet or use the Import Record button to select a existing Record worksheet from the Records workbook. Importing a Record overwrites the contents of the Record worksheet. If desired you should save the Record worksheet before replacing it with one from the Records workbook.
- Update the Yields and Graphs worksheets to show the results for any of the crop plans.
- Click on Option 1. to view graphs from any Crop Plan
- Select the desired Crop Plan from the dropdown list box.
- Click ok.
- Prepare a predefined set of charts comparing the runs. This includes a number of common graphs that chart yields against age, Dbh, and ht.
- Click on the Option 2.
- Click ok.
- Prepare one or more charts that you may define to compare the runs.
- Click on the Option 3. Choose the x and y axes as desired.
- Click ok.
- Repeat this sequence as desired to produce new charts. Note that a series of charts from the same, or different, runs can be produced since these charts are not updated by executing a model projection.
- Update the existing charts in the MyCharts worksheet. This updates charts based on the current contents (Yields) found in the Record worksheet. This allows the user to define a set of comparison charts that can be updated for each new growth projection.
- Click on the Option 4.
- Click ok.
- Print the active (charts) worksheet on the default printer.
- Save the Record, Chars, and Mycharts worksheets to a new workbook with the workbook name set to the Crop Plans ID.
Charts may be automatically updated following a projection or they may be manually updated depending on the setting for the checkbox at the bottom of the View Record dialog.
Caution
When viewing records using this dialog you must remember that after importing a Record worksheet, the Crop Plans, Stand, and Stand Table worksheets will not match the Yields and charts worksheets. This is signalled by the "INCOMPLETE" entry (highlighted in yellow) in the Date Run cell on the Stand worksheet. For more information, see the overview for the MGM workbook.