Tree List Generator
Implementation of the Tree List Generator (TLG) in MGM
In some cases, model users may not have full tree lists (i.e. tree-level observations of species, height, and diameter at breast height from area-based plots) for use in initializing MGM but may have summary statistics (e.g. average height, dominant height, average diameter, and density for each species) for the stands that they wish to simulate. For example, Reforestation Standard of Alberta (RSA) performance surveys (AAF 2020) do not sample full tree lists that are required by MGM to make projections. However, RSA performance surveys do provide useful summary data describing stand characteristics. To support use of RSA or similar types of data in MGM, models were developed to generate a full tree list from summary data. The input data required by these models includes mean height and diameter at breast height (DBH), their standard deviations, and maximum height. The MGM utility that produces a tree list from summary data is referred to as the Tree List Generator (TLG).
The initial development and application of the models used by the TLG are part of a larger project that was unpublished. We acknowledge the contribution by Ken Stadt and Zhili Feng in developing this innovative approach.
TLG Modeling Approach
The TLG estimates height and diameter distributions for each species using plot summary information. Then, individual trees are created using these height and diameter distributions. Although conceptually straightforward, the TLG’s approach considers the properties of regeneration survey data and explicitly links the height and diameter distributions. Several approaches for the fitting of distributions to describe diameter-height frequency data were developed and tested. The goal of these approaches was to develop unbiased estimates of tree populations from summary data (Johnson et al. 1999; Merganič and Sterba 2006). A bivariate Weibull approach for the truncated all-tree distribution was implemented in MGM’s TLG. This approach characterizes the relationship between tree heights and stem diameters, particularly around performance survey age (12 – 14 years).
Bivariate Weibull size distributions
Johnson et al. (1999) described a bivariate Weibull distribution (Equation T1)
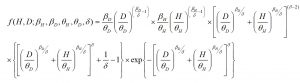
Where βH, θH, βD, θD are shape and scale parameters for diameter and height respectively; the fifth parameter, δ, introduces correlation between height and DBH, and can be estimated using maximum likelihood methods (Johnson et al. 1999). The range and average value of δ from our all-tree data sets were provided by Stadt and Feng (unpubl).
Truncated distribution corrections
In regeneration surveys, height is often the measured variable. A minimum size threshold is also frequently used in regeneration surveys, assuming that trees smaller than the threshold are unlikely to contribute to future yield. Thus, data collected are truncated and contain no information on the smallest trees. To describe stands without information on the smallest trees, Merganič and Sterba (2006) developed a multi-stage, iterative parameter estimation solution for the truncated Weibull distribution. A left-truncated Weibull has a probability density function defined in Equation T2 (McEwen and Parresol 1991).
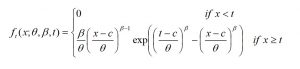
where β and θ are shape and scale parameters, t is the left truncation point (tagging limit) and c is the threshold. Once solved, β and θ estimate the shape and scale of the complete Weibull distribution if the data had no tagging limit. The rth moment of the left-truncated Weibull is given by Equation T3 (McEwen and Parresol, 1991).
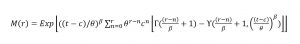
where γ(t) is the upper incomplete gamma function. The mean, standard deviation, and CV (μ’t, σ’t, CV’t) of the truncated distribution are calculated from the first and second moments (Equation T4 – T6).
Since the CV of the truncated distribution is very sensitive to changes in θ, but less sensitive to changes in β, Merganič and Sterba’s (2006) multi-stage iterative solution is: (a) starting with an estimate of θ and β generated under the assumption that the data are from a complete distribution (Equations T5 and T6), (b) find |CVt – CV’t| ≤ T1 by varying θ, (c) find |μt – μ’t| ≤ T2 by varying β, (iv) repeat steps b-c until both tolerance criteria (T1, T2) are simultaneously met.
Estimating Delta
Delta (δ ) is referred to as the fifth parameter and represents the non-negative correlation between the X (height) and Y (diameter). Although other parameters (βH, θH, βD, and θD) can be solved using several techniques, including the iterative method described above, δ is estimated using the Davies, Swann, and Campey algorithm to minimize –2 log L. In MGM, δ set to 0.35.
Estimating height and diameter of a tree for inclusion in the tree list
Once the 5 parameters and bivariate Weibull distribution have been estimated, individual trees need to be generated to populate the tree list. Johnson (1999) showed that X (height) and Y (diameter) can be represented by Equations T7 and T8.
where U is a random variable uniformly distributed (0,1) and V is distributed as the mixture of a standard exponential and standard gamma (2). The probability density function of V is defined in Equation T9.
The estimation of tree-level characteristics begins by generating five uniform random variables (U1, U2, U3, U4, U5).
Where U = U1 and V is obtained using equations T10 and T11 based on the values for U and δ
The sequence of estimating X (diameter) and Y (height) is repeated until the number of desired trees in the tree list is obtained (Equation T12) and tree factors are assigned (Equation T13).
where NumTrees is the desired number of simulated trees for the target species (Minimum = 40 trees, Maximum = 100 trees); SpeciesDensity is the density (Trees/ha) of the target species, and TF is the tree factor (Trees/ha) for each tree of the target species.
Using the TLG
The TLG is invoked using a crop plan “Establish” event or “Regen” event.
Using the TLG in an Establish Event
When using the TLG in an Establish event, add an Establish event, or modify a pre-existing Establish event.
- To add an Establish event, right-click on the row after an Options event, and select “Insert CP Event”. In the new dialog, select “Establish”, and click “OK”.
- To modify a pre-existing Establish event, right-click on an Establish event, and select “Edit CP Event”.
Then, proceed to the “TLG Dialog” section below.
Using the TLG in a Regen Event
Regen events use the TLG to add juvenile trees to an existing stand. When using the TLG in a Regen event, add a Regen event, or modify a pre-existing Regen event.
- To add a Regen event, choose a crop plan row after an Establish event. Then, right-click on the crop plan row, and select “Insert CP Event”. In the new dialog, select “Regen”, and click “OK”.
- To modify a Regen event, right-click on a Regen event, and select “Edit CP Event”.
Then, proceed to the “TLG Dialog” section below.
TLG Dialog
In the “Establish/Regenerate Stand” dialog, select the “Trees (StandAge <= 25 yrs)” tab. The TLG dialog will appear. Then, define the Stand ID, Stand WT (1), Stand Age, Year, and CMI. (Stand Age and Year are automatically populated on Regen events.) Set the Stand Origin. For tended deciduous cohorts, select “Aw_TendedAllTrees”, and for untended deciduous cohorts, select “Aw_NaturalAllTrees”. For all other species, select “PerfSurveyAllTrees”. Once the Stand Origin is identified, specify the species, site index, average density, tree age (i.e. Stand Age or approximate cohort age), average height, the standard deviation of height, maximum height, average DBH, and the standard deviation of DBH. Click the “Add” button to add a cohort. Then, enter summary information for additional cohorts (if applicable). When adding a cohort or leaving the TLG dialog (i.e. clicking “OK”), the input data is tested to ensure that a TLG solution can be achieved. If a solution cannot be found, the standard deviation of diameter may be adjusted in an attempt to find a solution. Warning messages will appear if crucial TLG inputs are missing. Pre-existing entries may be updated by clicking on a cohort under “Tree List Parameters”, updating the cohort information in the TLG dialog, and clicking “Replace”. After leaving the TLG dialog, the TLG parameters are written to the Establish or Regen event after “StandParsListSILV”.
Obtaining Summary Statistics and Defining TLG Cohorts
In most cases, TLG summary statistics should be obtained for each species in a stand. Then, these species-specific summary statistics are used to initialize individual cohorts in the TLG dialog. TLG summary statistics must also acknowledge any “special cohorts” that are created through stand tending and/or natural regeneration. For example, tended aspen stands may contain a primary cohort of large “crop tree” aspen and a secondary cohort of small aspen that regenerated following tending. In this case, separate TLG summary statistics should be entered for the large and small aspen cohorts. TLG summary statistics must also exclude veteran trees greater than 25 years old since the TLG was not designed to be used on trees > 25 years.
Executing the TLG
When a crop plan with a TLG stand is executed, the parameters set in the TLG dialog (and written to the Establish/Regen event) are passed to MGM’s TLG modules. Summary information for each cohort is used to calculate the bivariate Weibull parameters (betaH, thetaH, betaD and thetaD). These parameters describe the shape and the scale of the bivariate Weibull distribution, given the cohort’s mean height, mean DBH, and respective standard deviations . Once a cohort’s bivariate Weibull distribution is solved, height and DBH pairs are randomly drawn from the distribution and written to the MGM “Stands Worksheet”. The number of draws taken depends on the number of trees needed to represent the TLG cohort (Equation T12). This process is replicated for each cohort.
Untended aspen (“Aw_NaturalAllTrees”) versus tended aspen (“Aw_TendedAllTrees”)
Test projections using actual WESBOGY LTS tree lists and TLG simulations using WESBOGY LTS summary statistics showed that the bivariate Weibull distribution underestimated deciduous diameters for the untended WESBOGY treatments (Bokalo et al. 2020). Comparisons of long term WESBOGY projections also showed that untended treatments projected with the TLG underestimated deciduous yield (Bokalo et al. 2020). To correct these underestimates on untended deciduous trees, the bivariate Weibull distribution is used to predict deciduous height, and a DBH-height relationship is used to predict deciduous diameter (Huang 2016; Equation T14; Table T1). Diameter and volume underestimates were not observed for tended deciduous trees (Bokalo et al. 2020). As a result, the TLG’s bivariate Weibull distribution is used to predict both height and diameter on tended deciduous trees. The TLG Stand Origin for untended deciduous trees is “Aw_NaturalAllTrees”, and the TLG Stand Origin for tended deciduous trees is “Aw_TendedAllTrees”.
where DBH refers to the tree diameter (cm) measured at a breast height of 1.3 m above the ground; H is total tree height (m); exp or e is the exponent (e≈2.71828183); and b1, b2 and b3 are species-specific parameters (Huang 2016; Table T1).
Table T1. The DBH-height parameters for Equation T14 (Huang 2016).
| Species | b1 | b2 | b3 |
| Balsam Poplar | 1.3249 | 0.8053 | -0.0296 |
| Trembling Aspen | 1.1091 | 0.8055 | -0.0332 |
| White Birch | 1.3072 | 0.6892 | -0.0417 |
Please see MGM Research Note #2020-3 for more background information on the TLG.
Last Modified: July 12, 2021