Survival
For every year of modeled growth, MGM predicts an annual survival probability for each tree, relative to tree size, local competition, and/or other variables. Then, tree-level survival probability is multiplied by the tree factor to determine the surviving number of trees per hectare. (Tree factor is the number of trees per hectare that are represented by each tree in a treelist, based on the area of the sample plot.) Tree-level survival (tree factor) is summed across each stand to determine stand-level survival (trees/ha). Different survival models are used for trees ≥ 4cm DBH and trees < 4cm DBH.
Trees ≥ 4cm DBH
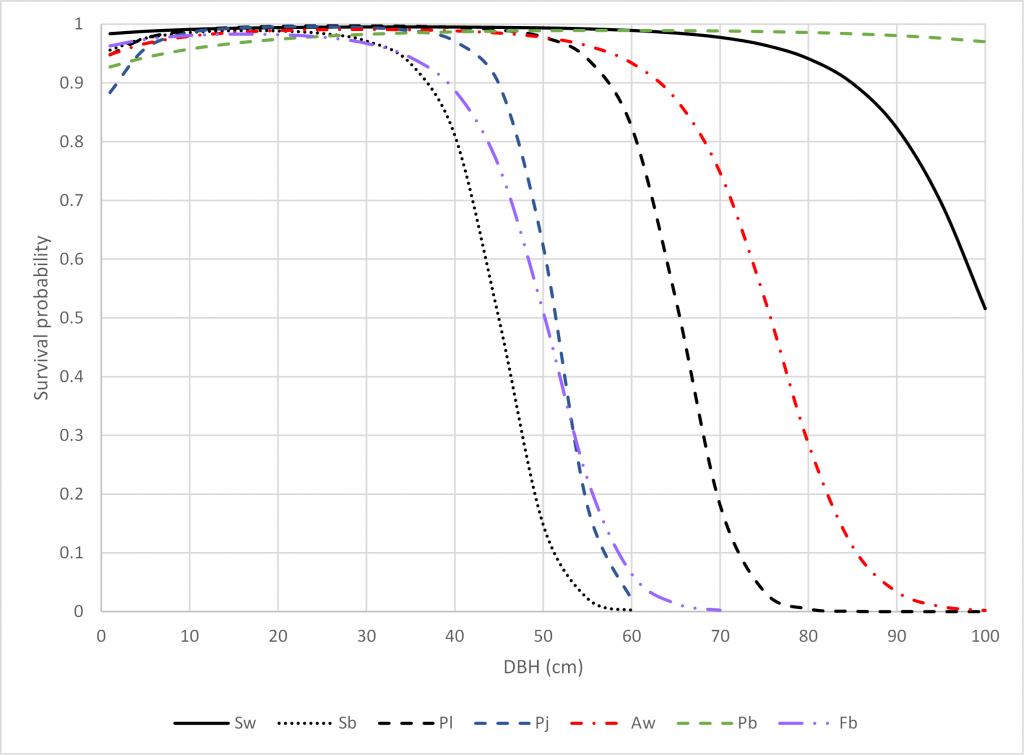
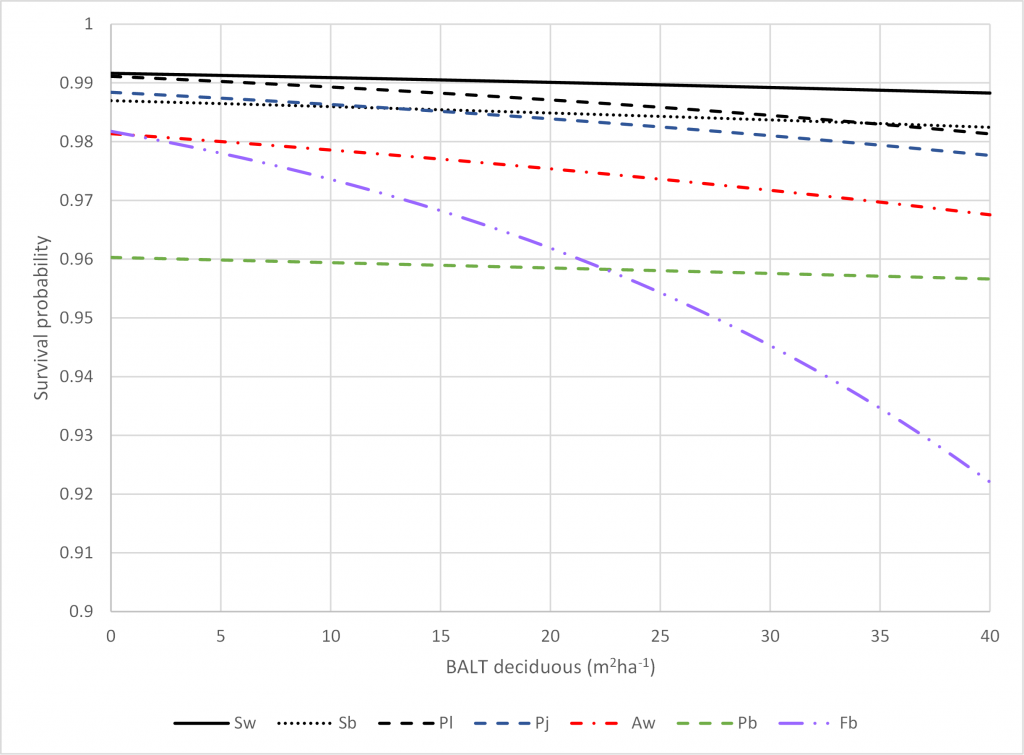
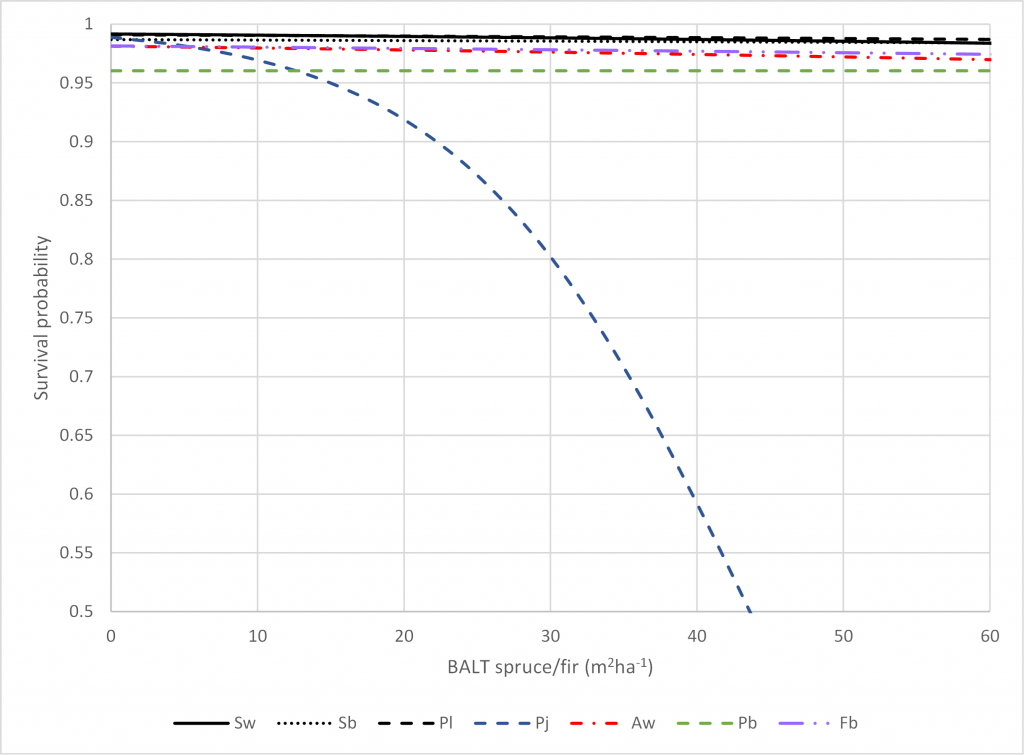
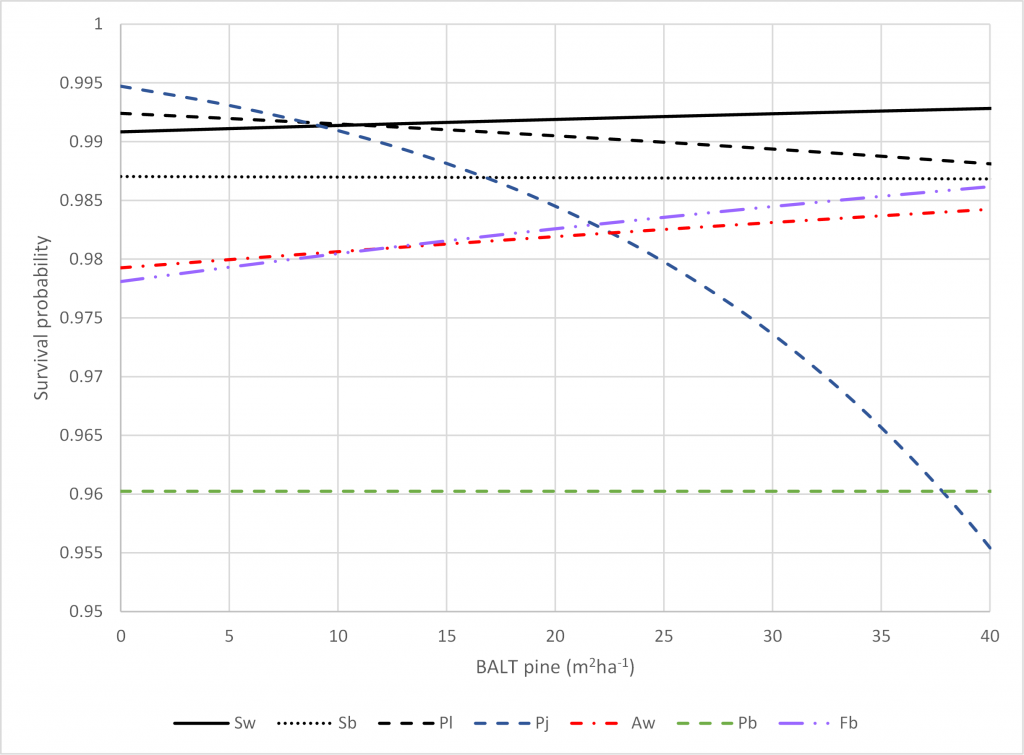
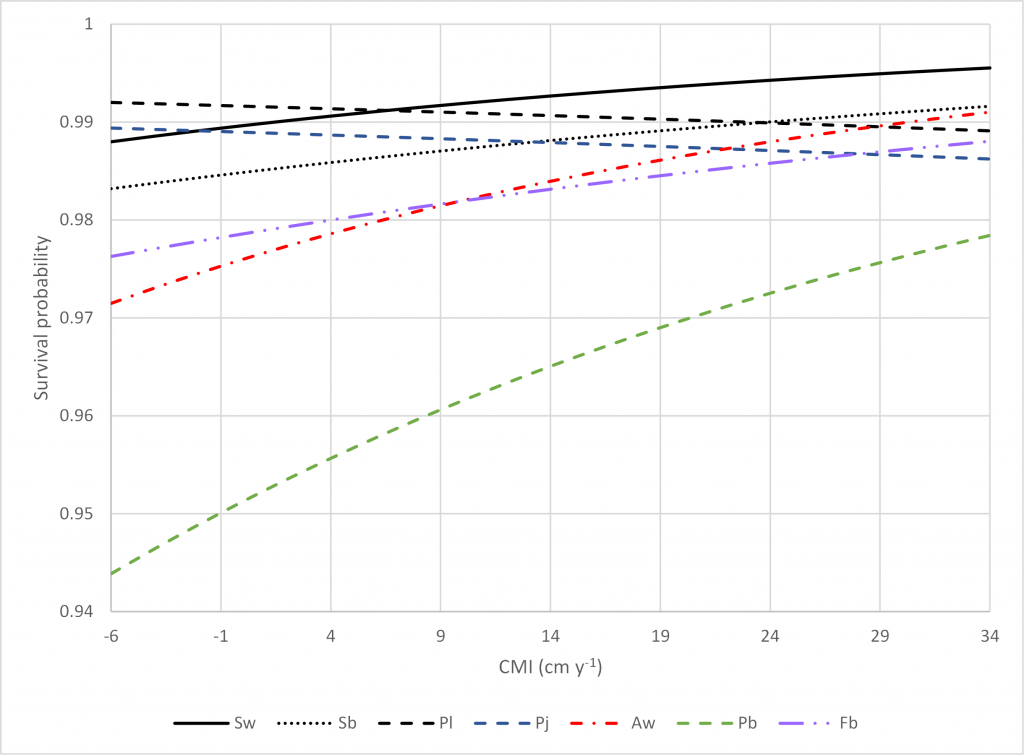
For trees ≥ 4cm DBH, annual survival probability is predicted using the Cortini et al. (2017) and Comeau (2021a) logistic models (Equation S1, Equation S2, and Table S1). These models are climate-sensitive and were developed using 11,673 Permanent Sample Plots across western Canada and Alaska. In addition to climate, the Cortini et al. (2017) and Comeau (2021a) models consider tree size, and local competition when predicting annual survival probability. Modeled species include white spruce, black spruce, lodgepole pine, jack pine, trembling aspen, balsam poplar, and balsam fir (Table S1).
Where:
Pijk = Annual survival probability of tree k of species j in stand i
c = Parameter c in Equation S1
DBHijk = Diameter at breast height (cm) of tree k of species j in stand i
DBALTijk = Basal area (m²/ha) of deciduous trees larger than subject tree k of species j in stand i
SFBALTijk = Basal area (m²/ha) of spruce-fir trees larger than subject tree k of species j in stand i
PBALTijk = Basal area (m²/ha) of pine trees larger than subject tree k of species j in stand i
CMIi = Mean annual Climate Moisture Index (Hogg et al. 2013) from 1981-2010 of stand i
a0 – a7 = Parameter estimates in Table S1
Table S1. The Cortini et al. (2017) and Comeau (2021a) parameter estimates for each modeled species in MGM. The “Origin” column identifies the author of each model. The “Application to Other Species” column indicates how MGM applies the Cortini et al. (2017) and Comeau (2021a) survival models to other species. The “-” symbol represents insignificant parameters and/or “not applicable” values.
| Modeled Species | Intercept (a0) | DBH (a1) | DBH2 (a2) | DBALT (a3) | SFBALT (a4) | PBALT (a5) | CMI (a6) | Origin | Application to Other Species |
| White Spruce | 3.7259 | 0.0804 | -0.0012 | -0.0086 | -0.0112 | 0.0062 | 0.0249 | Cortini et al. (2017) | Engelmann Spruce, Hybrid Spruce, Douglas Fir |
| Black Spruce | 2.7493 | 0.1920 | -0.0057 | -0.0076 | -0.0035 | -0.0004 | 0.01761 | Comeau (2021a) | Tamarack, Subalpine Larch, Western Larch |
| Lodgepole Pine | 2.9172 | 0.2273 | -0.0041 | -0.0188 | -0.0062 | -0.0113 | -0.0078 | Comeau (2021a) | |
| Jack Pine | 2.6166 | 0.3206 | -0.0069 | -0.0167 | -0.1027 | -0.0543 | -0.0066 | Comeau (2021a) | Limber Pine, Whitebark Pine, Ponderosa Pine |
| Trembling Aspen | 2.4327 | 0.1298 | -0.0022 | -0.0142 | -0.0082 | 0.0070 | 0.0294 | Cortini et al. (2017) | |
| Balsam Poplar | 2.2634 | 0.0700 | -0.0006 | -0.0023 | – | – | 0.0248 | Cortini et al. (2017) | White Birch, Black Cottonwood, Manitoba Maple, Bur Oak, White Elm |
| Balsam Fir | 2.8413 | 0.1229 | -0.0035 | -0.0379 | -0.0056 | 0.0117 | 0.0174 | Comeau (2021a) | Subalpine Fir |
Variable Impact:
The impact of each variable in Table S1 is identified in Figures S1 to S5. Please see Comeau (2021a) for a full explanation.
Maximum Size-Density Adjustment
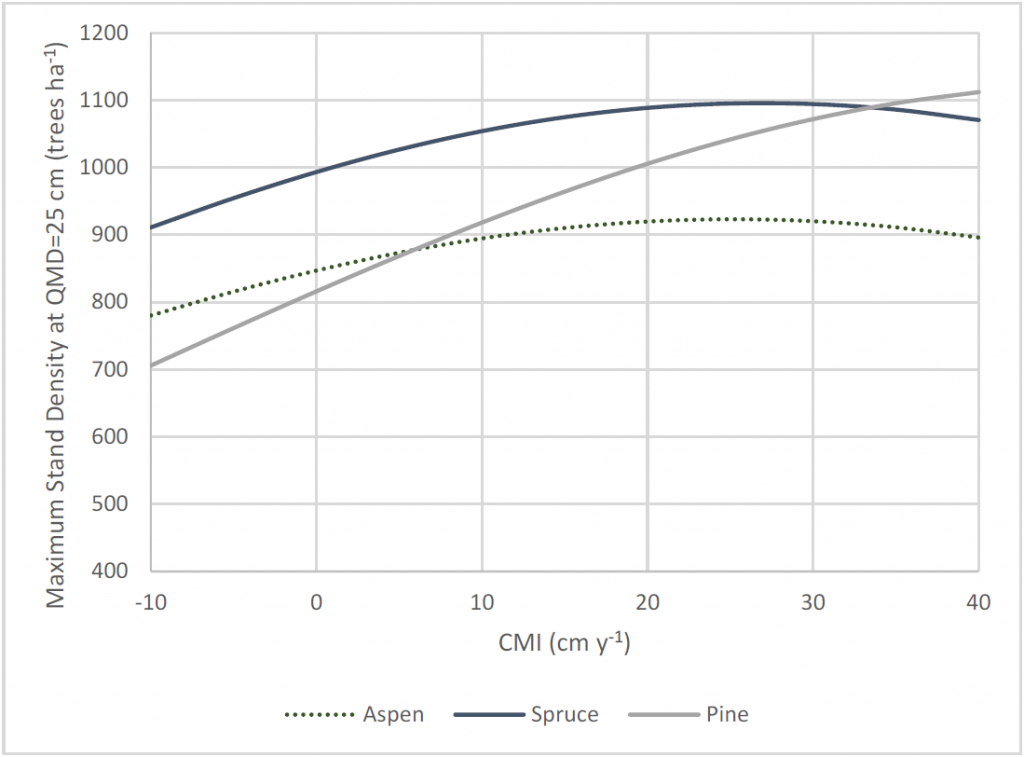
MGM also reduces the survival of trees ≥ 4cm DBH when stand density exceeds the maximum density defined by a maximum size-density relationship (Equation S3). MGM’s maximum size-density relationship considers the impact of climate, composition, and average tree size (QMD) on maximum stand density (Comeau 2021b). This relationship was developed using quantile regression (90th quantile) and data for 12 boreal tree species across 3,647 Permanent Sample Plots in western Canada and Alaska (Comeau 2021b). Composition in MGM’s maximum size-density relationship is expressed using 3 species groups: spruce-fir percent basal area (SFPBA), deciduous percent basal area (DPBA), and pine percent basal area (100% – SFPBA – DPBA). Under these groupings, Douglas-fir is associated with spruce-fir, and tamarack is associated with pine. MGM’s Maximum Size-Density Adjustment applies to all species and is always activated.
Where:
MaxDeni = Maximum density (trees/ha) of trees ≥ 4cm DBH in stand i
QMDi = Quadratic mean diameter (cm) of trees ≥ 4cm DBH in stand i; QMD may range from 4 to 100cm.
DPBAi = Percent basal area (%) of deciduous trees ≥ 4cm DBH in stand i
SFPBAi = Percent basal area (%) of spruce-fir trees ≥ 4cm DBH in stand i
CMIi = Mean annual Climate Moisture Index (Hogg et al. 2013) from 1981-2010 of stand i
a0 = 8.58702133, a1 = 0.90125965, a2 = -0.46007225, a3 = -0.00859626, a4 = 0.00196773, a5 = 0.00278608, a6 = 0.01314423, a7 = -0.00013532, a8 = -0.00006326, a9 = -0.00005859
Maximum Size-Density Relationship:
The properties of MGM’s maximum size-density relationship (Equation S3) are identified in Figures S6 and S7. Please see Comeau (2021b) for a full explanation.
Applying the Maximum Size-Density Adjustment
Stands with a QMD ≥ 4cm qualify for the Maximum Size-Density Adjustment under 2 modes:
- High Intensity Mode – An individual species group is overstocked relative to the stand-level maximum density. In this mode, spruce-fir density, deciduous density, or pine density (individually) exceed the stand-level maximum density (Equation S3).
- Standard Intensity Mode – The combined density of all species groups exceeds the stand-level maximum density (Equation S3).
Stands that qualify for the Maximum Size-Density Adjustment experience self-thinning on the smallest trees in the diameter-ranked treelist. Under High Intensity Mode, the Maximum Size-Density Adjustment (Equation S4) is applied to the bottom 1/3 of stems in the spruce-fir, deciduous, or pine species groups. Under Standard Intensity Mode, the Maximum Size-Density Adjustment (Equation S4) is applied to the bottom 1/3 of stems in the entire treelist, regardless of the species group.
Where:
Pmdaijk = Annual survival probability of tree k of species j in stand i after the maximum size-density adjustment
Pijk = Annual survival probability of tree k of species j in stand i from Equations S1 and S2
DBHijk = Diameter at breast height (cm) of tree k of species j in stand i
maxSpGrpDBHij = Maximum diameter at breast height (cm) of the species group for species j in stand i
maxDeni = Maximum density (trees/ha) of trees ≥ 4cm DBH in stand i from Equation S3
Den4i = Density (trees/ha) of trees ≥ 4cm DBH in stand i
Special Cases under the Maximum Size-Density Adjustment
The Maximum Size-Density Adjustment is not applied to deciduous trees when the deciduous mortality and deciduous maximum-size density equations from Bokalo et al. (2007) are being used (Equations S12 to S15). The Maximum Size-Density Adjustment is not applied to spruce-fir trees when deciduous trees or pine trees are undergoing high intensity self-thinning (Maximum Size-Density Adjustment Mode 1). The Maximum Size-Density Adjustment is also not applied to spruce-fir trees when stands carry less basal area than an equivalent, fully-stocked stand with a 100% spruce-fir composition (Equation S5).
Where:
EqSFBai = Basal area (m2/ ha) of an equivalent, fully-stocked stand i with a 100% spruce-fir composition
AreaConvConst = 7.8537E-05
EqSFMaxDeni = Maximum density (trees/ha) of an equivalent stand i with a 100% spruce-fir composition (Equation S3)
Trees < 4cm DBH
For trees with a DBH < 4cm, annual survival probability is modeled by MGM species group (i.e. white spruce, pine, trembling aspen, black spruce) using logistic survival probability models, maximum size-density relationships, and/or several additive approaches.
White Spruce Group
For white spruce > 1.3m tall and < 4cm DBH, annual survival probability is predicted using the Cortini et al. (2017) and Comeau (2021a) logistic models (Equation S1, Equation S2, and Table S1). These models are climate-sensitive and require DBH information. For white spruce ≤ 1.3m tall, annual survival probability is predicted using a logistic model developed in 2004 (Equation S1 and S6). This model is based on a 2004 analysis of the Alberta SDS (May 2004), WESBOGY LTS (December 2000), and Alberta regenerated permanent sample plot (December 2002) datasets. DBH information is not required for Equation S6.
Where:
c = Parameter c in Equation S1
Hijk = Height (m) of tree k of species j in stand i
SBALTijk = Basal area (m²/ha) of spruce trees larger than subject tree k of species j in stand i
a0 = 5.546121, a1 = 0.647729, a2 = -0.079591
Pine Group
For pine > 1.3m tall and < 4cm DBH, annual survival probability is predicted using the Cortini et al. (2017) and Comeau (2021a) logistic models (Equation S1, Equation S2, and Table S1). These models are climate-sensitive and require DBH information. For pine ≤ 1.3m tall, annual survival probability is predicted using a logistic model from the LFS monitor plots (Yao 1997, Equation S7, and Equation S8). DBH information is not required for Equation S8.
Where:
Pijk = Annual survival probability of tree k of species j in stand i
c = Parameter c in Equation S7
TAgeijk = Total age (years @ root collar) of tree k of species j in stand i
Hcmijk = Height (cm) of tree k of species j in stand i
TDeni = Total density (trees/ha) of stand i
PDeni = Pine density (trees/ha) of stand i
SQi = Site quality of stand i; (SQi = 0 if Site Index < 18; SQi = 1 if Site Index ≥ 18)
a0 = 12.0637, a1 = 0.44474, a2 = 0.2761, a3 = -0.5476, a4 = -2.393, a5 = 1.7123, a6 = -5.057, a7 = -0.742
Special Cases for Pine < 4cm DBH
For pine < 4cm DBH, annual survival probability from Cortini et al. (2017), Comeau (2021a), or Yao (1997) is also reduced under 3 conditions:
- Annual survival probability is constrained to a maximum of 0.98. (This assumes that juvenile pine mortality is at least 2% per year.)
- Annual survival probability is reduced using a maximum size-density adjustment (Equations S9 and S10).
- Annual survival probability is reduced in pure pine stands (Pine Relative Density ≥ 0.8) with a basal area > 40m2 using Equation S11.
Where:
Pmdaijk = Annual survival probability of tree k of species j in stand i after the maximum size-density adjustment
Pijk = Annual survival probability of tree k of species j in stand i from Equations S1 and S2 or Equations S7 and S8
maxDenJvPi = Maximum density (trees/ha) of stand i for stands with juvenile pine; The QMD floor is 1cm.
TDeni = Total density (trees/ha) of stand i
Ppbaijk = Annual survival probability of tree k of species j in stand i after the adjustment for pure pine stands with a high basal area
stBai = Stand basal area of stand i
Trembling Aspen Group
For trembling aspen with a DBH < 4cm, annual survival probability is assessed using annual mortality (Annual Mortality = 1 – Annual Survival Probability). Annual mortality is predicted in 4 stages to address the self-thinning characteristics of young trembling aspen:
- For each stand, deciduous mean height is used to define the biological maximum density. This biological maximum density is calculated using a Mean Height vs. Density Self-Thinning Function from Bokalo et al. (2007) (Equation S12).
- If deciduous density exceeds the biological maximum density, stand-level deciduous mortality is defined by Equation S13.
- If deciduous density falls below the biological maximum density, stand-level deciduous mortality is defined by Equation S14. This equation uses an empirical mortality constant (0.08) based on an examination of the WESBOGY LTS dataset in Bokalo et al. (2007).
- Stand-level deciduous mortality is apportioned to each tree using logistic survival probability models. (For example, deciduous trees with a low survival probability receive a larger share of stand-level deciduous mortality.) For deciduous trees > 1.3m tall and < 4cm DBH, deciduous mortality is apportioned using the Cortini et al. (2017) and Comeau (2021a) logistic models (Equation S1, Equation S2, and Table S1). These models are climate-sensitive and require DBH information. For deciduous trees ≤ 1.3m tall, deciduous mortality is apportioned using a logistic model (Equation S1 and S15). DBH information is not required for Equation S15.
Where:
BmaxDeni = Biological maximum density of stand i
DMHi = Deciduous mean height of stand i
stDmorti = Stand-level deciduous mortality (trees/ha) of stand i
DDeni = Deciduous density (trees/ha) of stand i
c = Parameter c in Equation S1
HIijk = Height increment (m) of tree k of species j in stand i
Hijk = Height (m) of tree k of species j in stand i
MHtall10Di = Mean height (m) of the tallest 10% of deciduous trees (i.e. deciduous canopy height) in stand i
a0 = -0.2472, a1 = 3.6967, a2 = 4.5031, a3 = -0.00000422
Black Spruce Group
For black spruce > 1.3m tall and < 4cm DBH, annual survival probability is predicted using the Cortini et al. (2017) and Comeau (2021a) logistic models (Equation S1, Equation S2, and Table S1). These models are climate-sensitive and require DBH information. For black spruce ≤ 1.3m tall, annual survival probability is assumed to be 0.995, due to insufficient data.
1 This function resides in the MGM21 Workbook (VBA)
2 This function resides in the MGM21 Growth Engine (DLL)
Last Modified: October 28, 2021